
The Smith Chart – A Quick Practical Guide
Winter is coming. The rains have already started, and snow may soon follow. Perfect time for radio amateurs to start erecting and tuning antennas 😉 on roofs and in yards.
It is no longer difficult to get hold of an antenna analyzer. Almost all modern devices offer a fantastic tool – the Smith Chart, which almost everyone is initially afraid of.
In reality, the Smith Chart is not that complicated. There are many videos on the Internet, but there are also people who prefer to read and digest written information. It could hardly be explained in a simpler or more „digestible“ way than the text below.
What the Smith Chart Shows When Tuning 50 Ω Antennas
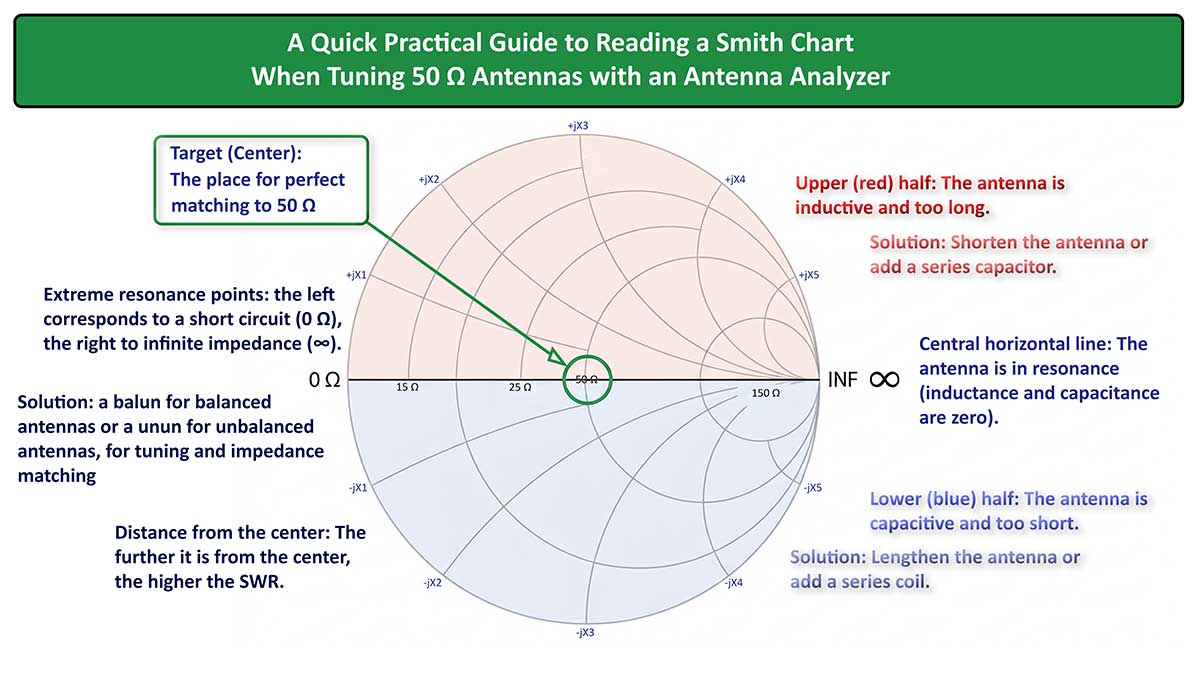
The goal we must achieve is the magic number 50 Ω (R = 50 Ω, X = 0). Here SWR = 1:1 (perfect match). This is the exact center of the chart.
The further the marker is from the center (50 Ω), the higher the SWR, regardless of which direction it lies in.
You will not see your antenna graph as a single dot right in the center, especially across an entire frequency band. But how do we „nudge“ it as close as possible to the center for our operating frequencies? Here are the typical scenarios and their solutions:
1. Vertical Deviation (Reactance X ≠ 0)
🔴 Upper Half – Red (+jX): Inductive Character (X > 0)
Diagnosis: The antenna is electrically too long.
Solution:
- Shorten the conductor (radiators, elements), or
- Add a series capacitor.
🔵 Lower Half – Blue (-jX): Capacitive Character (X < 0)
Diagnosis: The antenna is electrically too short.
Solution:
- Lengthen the conductor (radiators, elements), or
- Add a series loading coil, or
- Use a Capacitive Hat (Capacity Hat) – an extremely elegant physical solution for electrically lengthening antennas during SOTA/POTA activations or when physical length cannot be increased.
2. Along the Central Horizontal Line (Resonance X = 0)
If the marker lies on the horizontal line, the antenna is in resonance (the reactive part jX = 0). However, if the marker is not at the very center (50 Ω), there is a difference in active resistance (R ≠ 50 Ω):
⬅️ Left of Center (R < 50 Ω): Low Resistance
Causes: Low-slung dipole, vertical antenna with an excellent ground/radial system (~35 Ω), or a Yagi antenna element.
Solution:
- Raise the antenna or radials higher above the ground.
- If this is the structural resistance of the antenna, use Gamma match, Hairpin match, or a step-down/step-up transformer (e.g., 1:2 or 1:4).
- Antenna Tuner (ATU / Transmatch): Manual or automatic tuner for quick matching of various (balanced/unbalanced) antennas to 50 Ω.
➡️ Right of Center (R > 50 Ω): High Resistance
Causes: Folded dipole (200 Ω), Windom/OCFD (200 Ω), „Rybakov“ type antennas (150-300 Ω), Random Wire / Long Wire antennas (450 Ω), End-Fed Half Wave / EFHW (2500-3000 Ω), or broadband antennas.
Solution: Use a matching Balun or Unun with an appropriate ratio:
- 4:1 (for impedance around 200 Ω – Rybakov, Windom, Loop)
- 9:1 (for impedance around 450 Ω – Random Wire / Long Wire over 12.5 m)
- 49:1 or 64:1 (for End-Fed Half-Wave antennas from 2400-3200 Ω)
- Antenna Tuner (ATU / Transmatch): Manual or automatic tuner for quick matching of various (balanced/unbalanced) antennas to 50 Ω.
3. Extreme Points of the Horizontal Line
- Far Left (0 Ω): Short circuit.
- Far Right (∞ Ω): Open circuit (break).
⚠️ Extreme points indicate a serious issue!
Immediately search for the cause – it might even be visible to the naked eye or you might be measuring the wrong port/cable. In a tangle of cables, this can easily happen.
Is this guide easy to understand?
Please share your feedback in the comments below.
Feel free to share your personal experience – it will certainly be useful to many fellow ham operators!